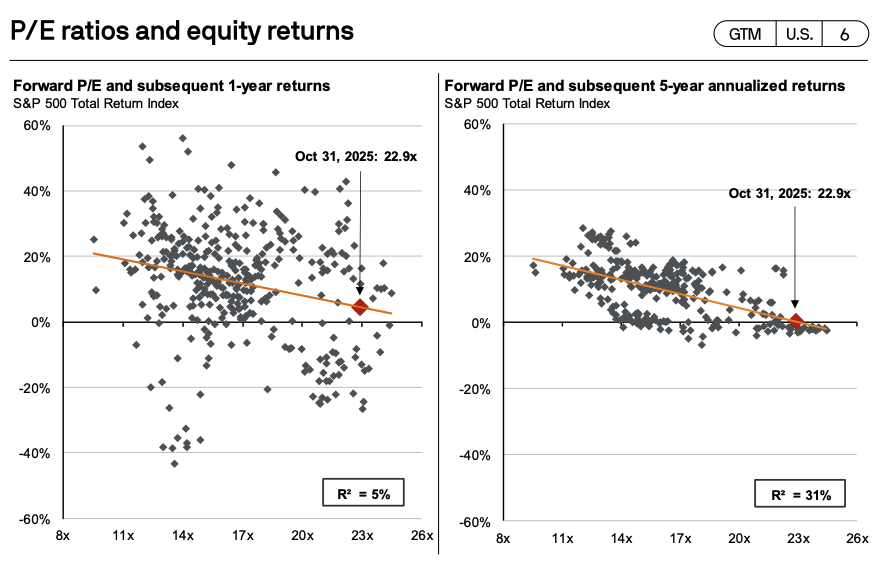
We will keep it short and sweet this week; The below chart from JP Morgan’s research department shows that for 5-year annualized returns a much stronger, clearly visible inverse correlation between the starting forward P/E ratio and the subsequent returns. The higher the starting P/E, the lower the average annualized return tends to be over the next five years. The specific data point we would like to highlight—, the current forward P/E of around 23 times earnings—sits historically at the point where the subsequent 5-year annualized return has clustered around 0% (ranging roughly from -2% to +2%). Investors should consider this as it pertains to their S&P 500 centric porfolios, which if history is any guidance are highly likely to endure flat returns for the next 5 years or so.